Well, yes, there is growth! But not because the government is doing anything about it - it's always easy to have a comparatively better economic situation than during an outright economic collapse - and rather simply because Koo's balance sheet recession bounce-back is in play.
I wrote about in December: the Icelandic economy was in a "Lehman Brothers shock" where the actual bankruptcy effects and the sheer collapse of the financial system had been the main contributor for the collapse in GDP. But once the financial panic cleared out of the system the GDP growth came back, automatically, as the economy calmed down. In the meanwhile, balance sheet recession was inevitable since too much corporate and household debt made it impossible for the economy to grow at a rate that was even close to what it had been growing at before.
I might be fooling myself and under the spell of Galbraith ("faced with the choice between changing one's mind and proving that there is no need to do so, almost everyone gets busy on the proof") but I'm going to stick to that case: the Icelandic GDP growth is due to an automatic bounce-back from the financial collapse and panic and the "thoroughly confirmed" economic improvement is in reality an economy that is burdened with a balance sheet recession.
I've got some points to argue why:
1. GDP growth is considerably lower now than it was before, even measured in ISK. Notice how comparable the quarterly GDP growth figures are to Koo's "Lehman Shock" theory (see next set of figures).
Growth in GDP, measured in ISK, is still below what may be considered as historically normal. The sluggish growth is a sign of a balance sheet recession where debt and debt deflation are holding the economy back.
2. The above GDP growth figures are in the domestic currency. Icelandic GDP measured in Special Drawing Rights (SDRs) is merely the shadow of itself - a 65% shadow of itself to be exact since the value of Icelandic GDP has collapsed by 35% since its top in 2007. Admittedly, this is better than the horrendous 45% collapse straight after and during the collapse but again, that is an automatic bounce-back from the panic and not genuine "thoroughly confirmed" return of economic health.
Icelandic GDP measured in non-CPI deflated SDRs (billions of SDR per quarter). Compare the Iceland's GDP growth figures to Exhibit 16 from Koo's paper
3. Investment is still not coming back, causing historically very high unemployment. I know +7% unemployment may not sound much in the ears of a young unemployed Spanish person but for Iceland, that's pretty high. Those are, as far as I can figure out, numbers that are more or less comparable to U-3 unemployment (no U-6 unemployment figures are available).
Investment as a share of GDP, four-quarter moving average. Investment has hardly bleeped above 15% of GDP while it needs to be much closer to the 20% value to be considered "normal".
4. The debt deflation is quite simply so obvious in the the new Central Bank's data on financial stability that we need not discuss the matter any further. The Icelandic economy is in full-swing debt deflation! And contrary to what the Central Bank might think, raising the interest rates is not the right thing to do in such a situation!!
Debt of Icelandic households, % of GDP. Blue = indexed; purple = FX linked; orange = nonindexed loans, comparable to normal mortgages in Europe; green = overdraft; dark blue = leasing contracts
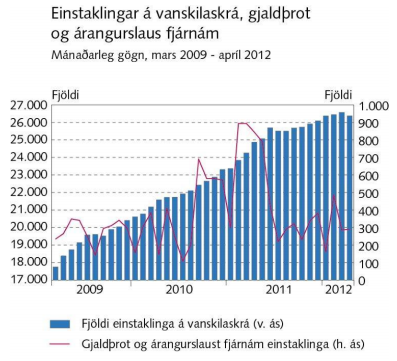
Number of individuals on list of deferred payments (red line: number of bankruptcies and unsuccessful attached properties)
Debt of non-financial corporates as % of GDP. Blue = CPI indexed; purple = nonindexed, normal loans; orange = FX linked (great idea, lets mostly indebt us in foreign currencies!!)
Debt of non-financial corporates, European comparison (% of GDP). Does anybody know the Icelandic word for "debt deflation"?
So I'm afraid I'm just as bearish as before: the Icelandic economy is in the fastest debt deflation process that I've ever seen.
The main thing that makes this possible is the around 40% discount the Icelandic banks received as their "birth gift" when they were established in 2008: the loan portfolio was transferred from the old banks into the new ones at a 40% discount which was not forwarded to the borrowers who saw their debts, in many cases, grow in monetary terms due to indexation of mortgages.
As long as the banks are milking out the discount they received in 2008, the economy will not collapse entirely again. But that's only for the short term. If the debts are not gotten rid off, the problem will persist. And the intrinsic systemic factors lead to ever growing value of debts, due to high interest rates and indexation on mortgages. The financial system has to be reformed bottom up - pension funds and indexation are on the top of the list and close thereafter is the monetary policy - simply because it will not stand the test of time in its current form. The Icelandic financial system is built to collapse, just as it was before 2008.


No comments:
Post a Comment