"Average household expenditure 2009-2011 is 443 thousand ISK a month and has increased by 0.4% from the 2008-2010 survey. The CPI rose by 4.0% between 2010 and 2011, hence the real household expenditure declined by 3.5%" Take note that this includes all expenditures, including housing and housing costs and not only consumption.
Here are the data from Statistics Iceland. We can see that the households are contracting their expenditures, based on these data, en masse since 2007. In monetary terms, they've only levelled off despite a 38% increase in the CPI from 2007 to 2011.
Households' total average expenditures in nominal and real (2011 prices) terms. Data from Statistics Iceland.
Now, there have been speculations that the households are consuming too much in Iceland. The overdrafts borrowing and the liquidation of private pension fund assets are taken as a sign of this conspicuous consumption, even though it should be obvious, given the shock from the financial crisis, that households should getting their financial situation in order, not binge borrowing more! As an example of this view, the newspaper Morgunbladid had an article on 21 November where two commentators (one of them my former teacher and boss at Kaupthing Research, Dr. Asgeir Jonsson) expressed this view.
One of them, Gustaf Steingrimsson at the research department of Landsbanki, noted that households had liquidated 75 billion ISK of their pension assets since March 2009. Jonsson in the meanwhile applied the permanent income hypothesis and said that after the temporary blow to income in 2008, households were back to prior (unrealistic) consumption levels, borrowing or liquidating their wealth to fund their consumption and trusting that they would be able to find income in the future to pay the whole lot back.
Well, no! Not according to the data! In real terms, household expenditures are back down way below their 2003 levels and almost a fifth less than they were in 2007 when the borrowing binge was admittedly conspicuous! In the meanwhile, the 2011 expenditures are also way below the average households' expenditures over the period of 2002-2011. We can hardly say that households are guilty of continuing the pre-2008 gluttony!
Households' expenditures are nearly a fifth lower than in 2007 and 9% less than in 2003.
Even a clearer picture is given when we take housing cost away from households' total expenditures.
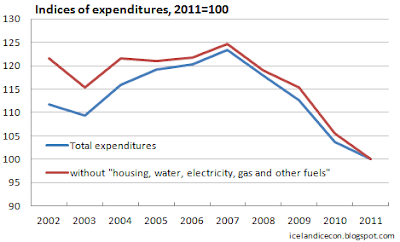
What I've done in the graph below is to deduct the "housing, water, electricity, gas and other fuels" part from the total expenditures. What should be left is then mainly consumptive items and services. The idea is to try and focus on that sum specifically and consequently try to judge whether households' consumption, not total expenditures, are of the outrageous sort.
Indices of households' expenditures, based on CPI corrected nominal terms. Notice that the drop in expenditures leaving housing aside is relatively more than in total expenditures.
This graph tells us two things:
1) The growth in consumption before the crash was large but not the main contributor to the fact that households' expenditures grew so quickly and exorbitantly. Yes, there is a great increase from 2003 to 2007 but the main increase in expenditures is, seemingly, due to the fantastic increase in housing cost.
2) The contraction in consumption is greater than in the total expenditures of households which, on top of consumption, take the cost of housing into the account. Since 2002, expenditures due to consumption has dropped nearly 18% while total expenditures, including housing costs, have only gone down by 11%.
Based on all this, no one can rightfully say that households are not contracting their consumption. The liquidation of pension assets is consequently not to finance irrational consumption but rather to finance the cost of housing, there included interests and repayments of principal. And as expected, housing cost has increased significantly since 2002, both in real terms but especially as a percentage of households' total expenditures.
Housing has increased its prominence as a share of total households' expenditures. Today, households spend more money on housing than food, non-alcoholic beverages, recreation and culture combined.
Sorry folks, Icelandic households are hardly lacking in effort to decrease unnecessary consumption. They are rather fighting to repay their mortgage debts.
Too bad the indexation keeps renewing them.


